Before

The threat events platform now has threat insights available for some relevant parent events. Threat intelligence analyst users can access these insights for their threat hunting activity.
Insights are also highlighted in the Cloudflare dashboard by a small lightning icon and the insights can refer to multiple, connected events, potentially part of the same attack or campaign and associated with the same threat actor.
For more information, refer to Analyze threat events.
This week’s release introduces a critical detection for CVE-2025-61757, a vulnerability in the Oracle Identity Manager REST WebServices component.
Key Findings
This flaw allows unauthenticated attackers with network access over HTTP to fully compromise the Identity Manager, potentially leading to a complete takeover.
Impact
Oracle Identity Manager (CVE-2025-61757): Exploitation could allow an unauthenticated remote attacker to bypass security checks by sending specially crafted requests to the application's message processor. This enables the creation of arbitrary employee accounts, which can be leveraged to modify system configurations and achieve full system compromise.
| Ruleset | Rule ID | Legacy Rule ID | Description | Previous Action | New Action | Comments |
|---|---|---|---|---|---|---|
| Cloudflare Managed Ruleset | N/A | Oracle Identity Manager - Pre-Auth RCE - CVE:CVE-2025-61757 | N/A | Block | This is a new detection. |
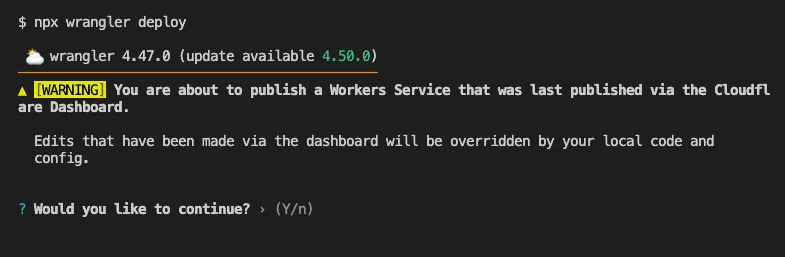
Until now, if a Worker had been previously deployed via the Cloudflare Dashboard ↗, a subsequent deployment done via the Cloudflare Workers CLI, Wrangler
(through the deploy command), would allow the user to override the Worker's dashboard settings without providing details on
what dashboard settings would be lost.
Now instead, wrangler deploy presents a helpful representation of the differences between the local configuration
and the remote dashboard settings, and offers to update your local configuration file for you.
See example below showing a before and after for wrangler deploy when a local configuration is expected to override a Worker's dashboard settings:
Before
After
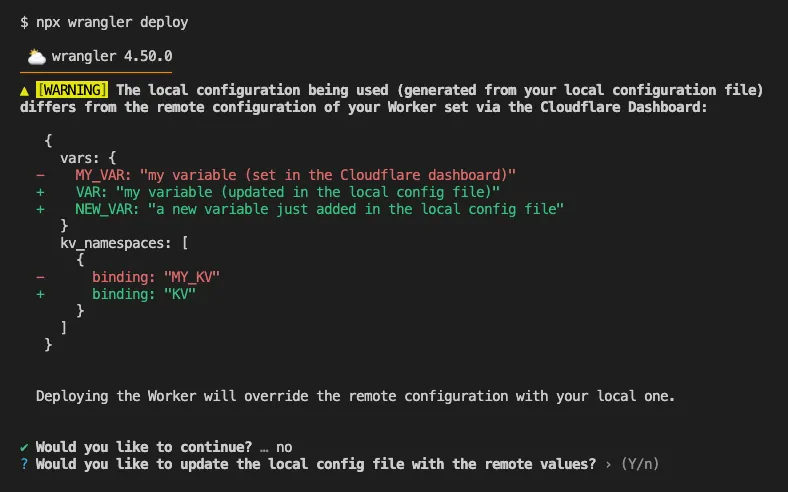
Also, if instead Wrangler detects that a deployment would override remote dashboard settings but in an additive way, without modifying or removing any of them, it will simply proceed with the deployment without requesting any user interaction.
Update to Wrangler v4.50.0 or greater to take advantage of this improved deploy flow.
Workers Builds now supports up to 64 environment variables, and each environment variable can be up to 5 KB in size. The previous limit was 5 KB total across all environment variables.
This change enables better support for complex build configurations, larger application settings, and more flexible CI/CD workflows.
For more details, refer to the build limits documentation.
Earlier this year, we announced the launch of the new Terraform v5 Provider. We are aware of the high number of issues reported by the Cloudflare community related to the v5 release. We have committed to releasing improvements on a 2-3 week cadence ↗ to ensure its stability and reliability, including the v5.13 release. We have also pivoted from an issue-to-issue approach to a resource-per-resource approach ↗ - we will be focusing on specific resources to not only stabilize the resource but also ensure it is migration-friendly for those migrating from v4 to v5.
Thank you for continuing to raise issues. They make our provider stronger and help us build products that reflect your needs.
This release includes new features, new resources and data sources, bug fixes, updates to our Developer Documentation, and more.
Please be aware that there are breaking changes for the cloudflare_api_token and cloudflare_account_token resources. These changes eliminate configuration drift caused by policy ordering differences in the Cloudflare API.
For more specific information about the changes or the actions required, please see the detailed Repository changelog ↗.
We suggest holding off on migration to v5 while we work on stabilization. This help will you avoid any blocking issues while the Terraform resources are actively being stabilized. We will be releasing a new migration tool in March 2026 to help support v4 to v5 transitions for our most popular resources.
AI Search now supports custom HTTP headers for website crawling, solving a common problem where valuable content behind authentication or access controls could not be indexed.
Previously, AI Search could only crawl publicly accessible pages, leaving knowledge bases, documentation, and other protected content out of your search results. With custom headers support, you can now include authentication credentials that allow the crawler to access this protected content.
This is particularly useful for indexing content like:
To add custom headers when creating an AI Search instance, select Parse options. In the Extra headers section, you can add up to five custom headers per Website data source.
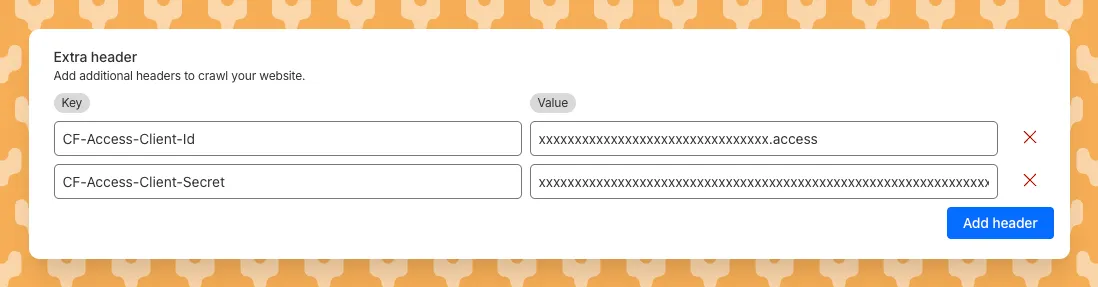
For example, to crawl a site protected by Cloudflare Access, you can add service token credentials as custom headers:
CF-Access-Client-Id: your-token-id.accessCF-Access-Client-Secret: your-token-secretThe crawler will automatically include these headers in all requests, allowing it to access protected pages that would otherwise be blocked.
Learn more about configuring custom headers for website crawling in AI Search.
We will listen carefully to your feedback and continue to find comprehensive ways to communicate updates on your submissions. Your submissions will continue to be addressed at an even greater rate than before, fuelling faster and more accurate email security improvement.
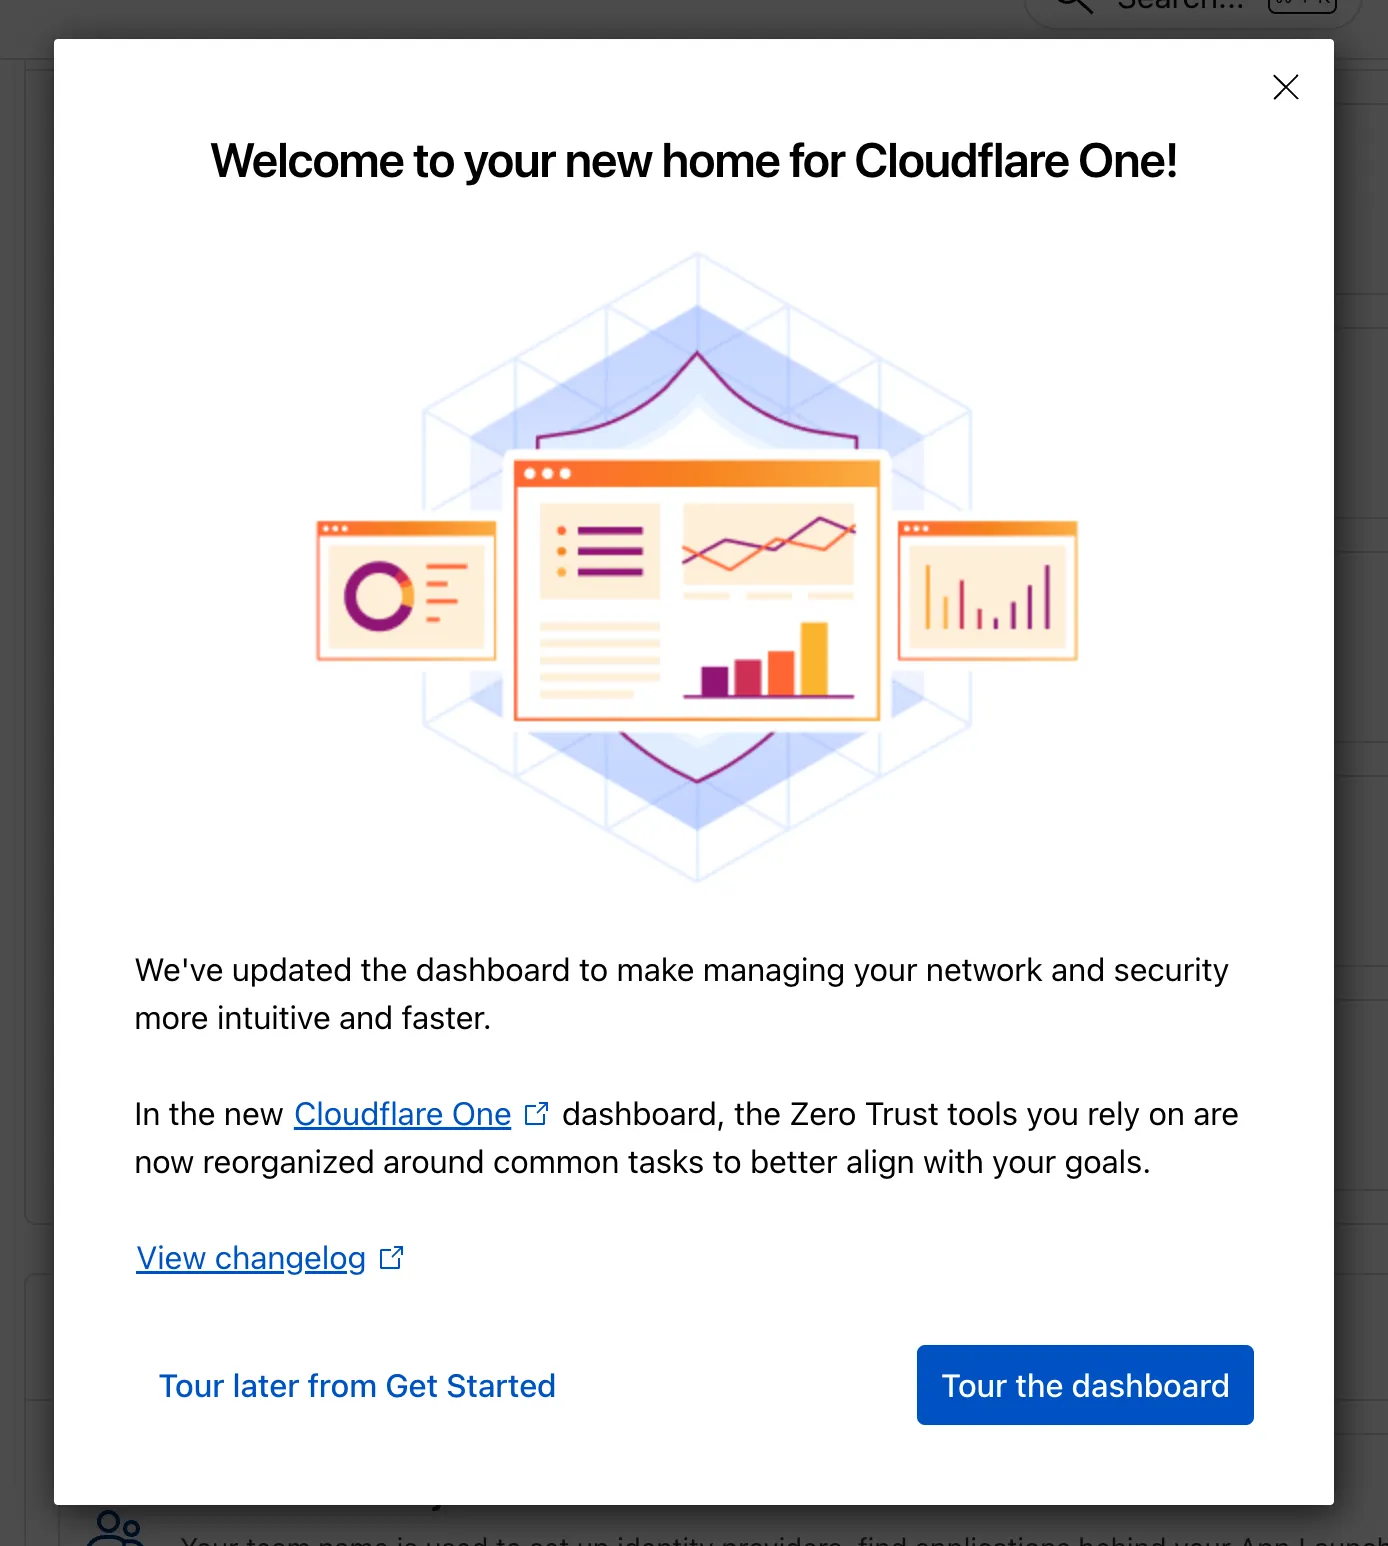
The Zero Trust dashboard and navigation is receiving significant and exciting updates. The dashboard is being restructured to better support common tasks and workflows, and various pages have been moved and consolidated.
There is a new guided experience on login detailing the changes, and you can use the Zero Trust dashboard search to find product pages by both their new and old names, as well as your created resources. To replay the guided experience, you can find it in Overview > Get Started.
Notable changes
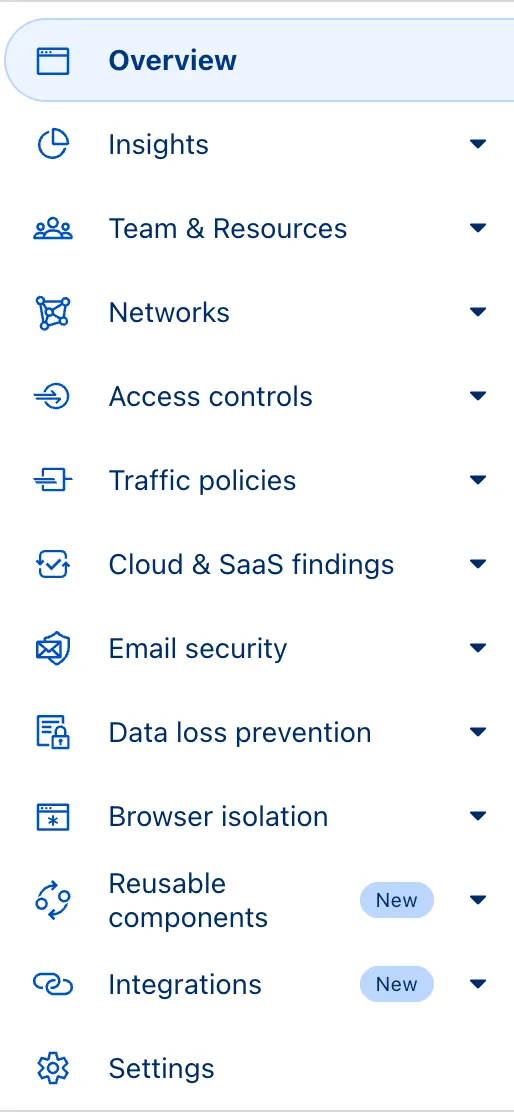
No changes to our API endpoint structure or to any backend services have been made as part of this effort.
This week highlights enhancements to detection signatures improving coverage for vulnerabilities in DELMIA Apriso, linked to CVE-2025-6205.
Key Findings
This vulnerability allows unauthenticated attackers to gain privileged access to the application. The latest update provides enhanced detection logic for resilient protection against exploitation attempts.
Impact
| Ruleset | Rule ID | Legacy Rule ID | Description | Previous Action | New Action | Comments |
|---|---|---|---|---|---|---|
| Cloudflare Managed Ruleset | N/A | DELMIA Apriso - Auth Bypass - CVE:CVE-2025-6205 | Log | Block | This is a new detection. | |
| Cloudflare Managed Ruleset | N/A | PHP Wrapper Injection - Body | N/A | Disabled | Rule metadata description refined. Detection unchanged. | |
| Cloudflare Managed Ruleset | N/A | PHP Wrapper Injection - URI | N/A | Disabled | Rule metadata description refined. Detection unchanged. |
SSH with Cloudflare Access for Infrastructure allows you to use short-lived SSH certificates to eliminate SSH key management and reduce security risks associated with lost or stolen keys.
Previously, users had to generate this certificate by using the Cloudflare API ↗ directly. With this update, you can now create and manage this certificate in the Cloudflare One dashboard ↗ from the Access controls > Service credentials page.
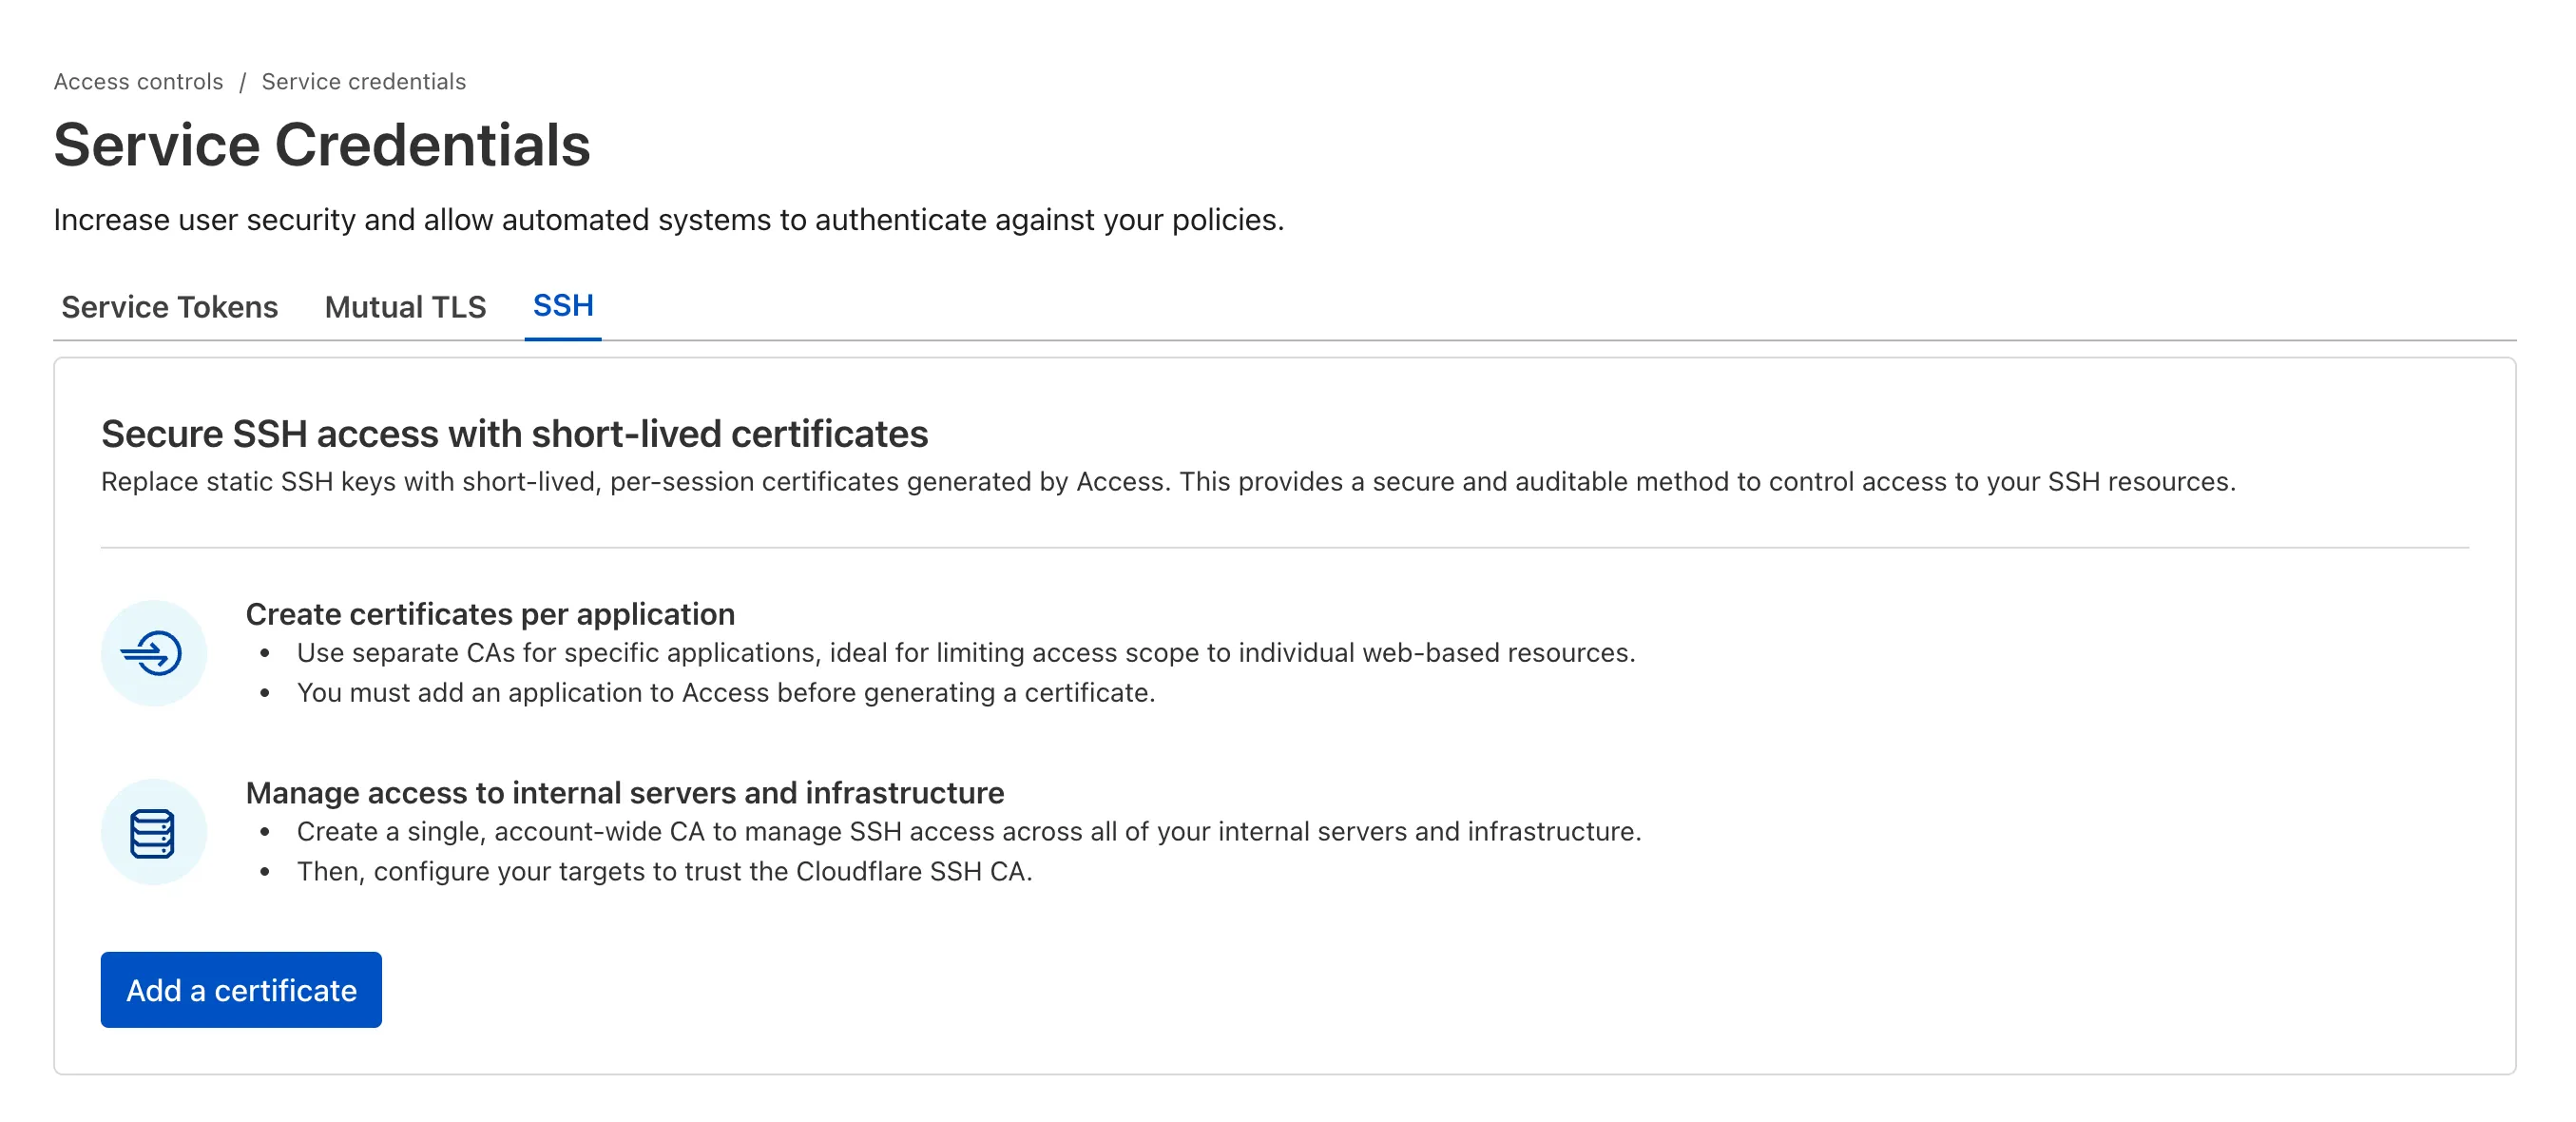
For more details, refer to Generate a Cloudflare SSH CA.
You can now stay on top of your SaaS security posture with the new CASB Weekly Digest notification. This opt-in email digest is delivered to your inbox every Monday morning and provides a high-level summary of your organization's Cloudflare API CASB findings from the previous week.
This allows security teams and IT administrators to get proactive, at-a-glance visibility into new risks and integration health without having to log in to the dashboard.
To opt in, navigate to Manage Account > Notifications in the Cloudflare dashboard to configure the CASB Weekly Digest alert type.
The CASB Weekly Digest notification is available to all Cloudflare users today.
We've resolved a bug in Log Explorer that caused inconsistencies between the custom SQL date field filters and the date picker dropdown. Previously, users attempting to filter logs based on a custom date field via a SQL query sometimes encountered unexpected results or mismatching dates when using the interactive date picker.
This fix ensures that the custom SQL date field filters now align correctly with the selection made in the date picker dropdown, providing a reliable and predictable filtering experience for your log data. This is particularly important for users creating custom log views based on time-sensitive fields.
We've significantly enhanced Log Explorer by adding support for 14 additional Cloudflare product datasets.
This expansion enables Operations and Security Engineers to gain deeper visibility and telemetry across a wider range of Cloudflare services. By integrating these new datasets, users can now access full context to efficiently investigate security incidents, troubleshoot application performance issues, and correlate logged events across different layers (like application and network) within a single interface. This capability is crucial for a complete and cohesive understanding of event flows across your Cloudflare environment.
The newly supported datasets include:
Dns_logsNel_reportsPage_shield_eventsSpectrum_eventsZaraz_eventsAudit LogsAudit_logs_v2Biso_user_actionsDNS firewall logsEmail_security_alertsMagic Firewall IDSNetwork AnalyticsSinkhole HTTPipsec_logsYou can now use Log Explorer to query and filter with each of these datasets. For example, you can identify an IP address exhibiting suspicious behavior in the FW_event logs, and then instantly pivot to the Network Analytics logs or Access logs to see its network-level traffic profile or if it bypassed a corporate policy.
To learn more and get started, refer to the Log Explorer documentation and the Cloudflare Logs documentation.
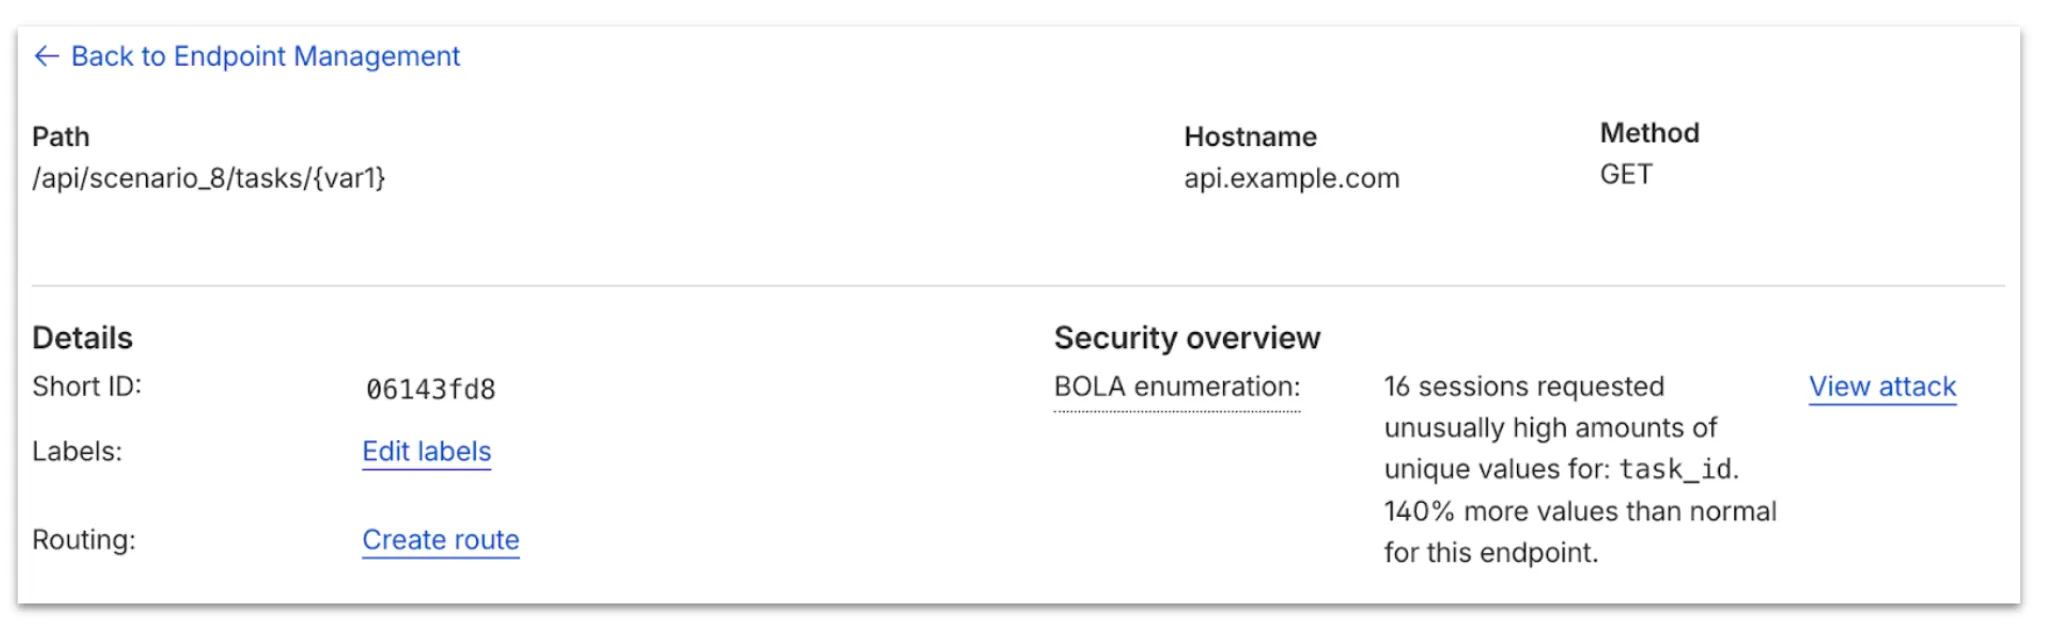
Now, API Shield automatically searches for and highlights Broken Object Level Authorization (BOLA) attacks on managed API endpoints. API Shield will highlight both BOLA enumeration attacks and BOLA pollution attacks, telling you what was attacked, by who, and for how long.
You can find these attacks three different ways: Security Overview, Endpoint details, or Security Analytics. If these attacks are not found on your managed API endpoints, there will not be an overview card or security analytics suspicious activity card.
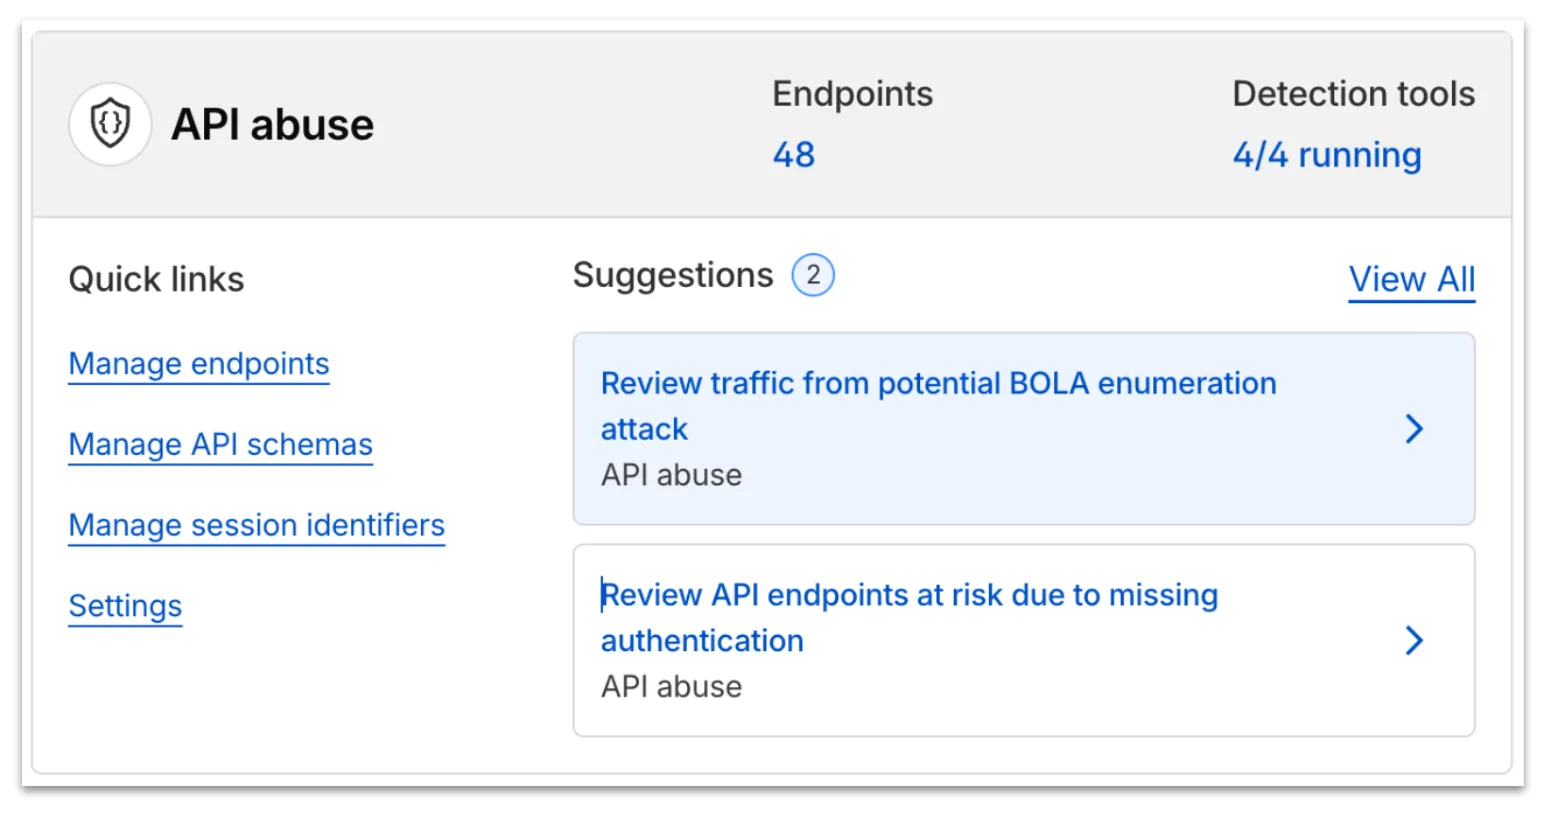
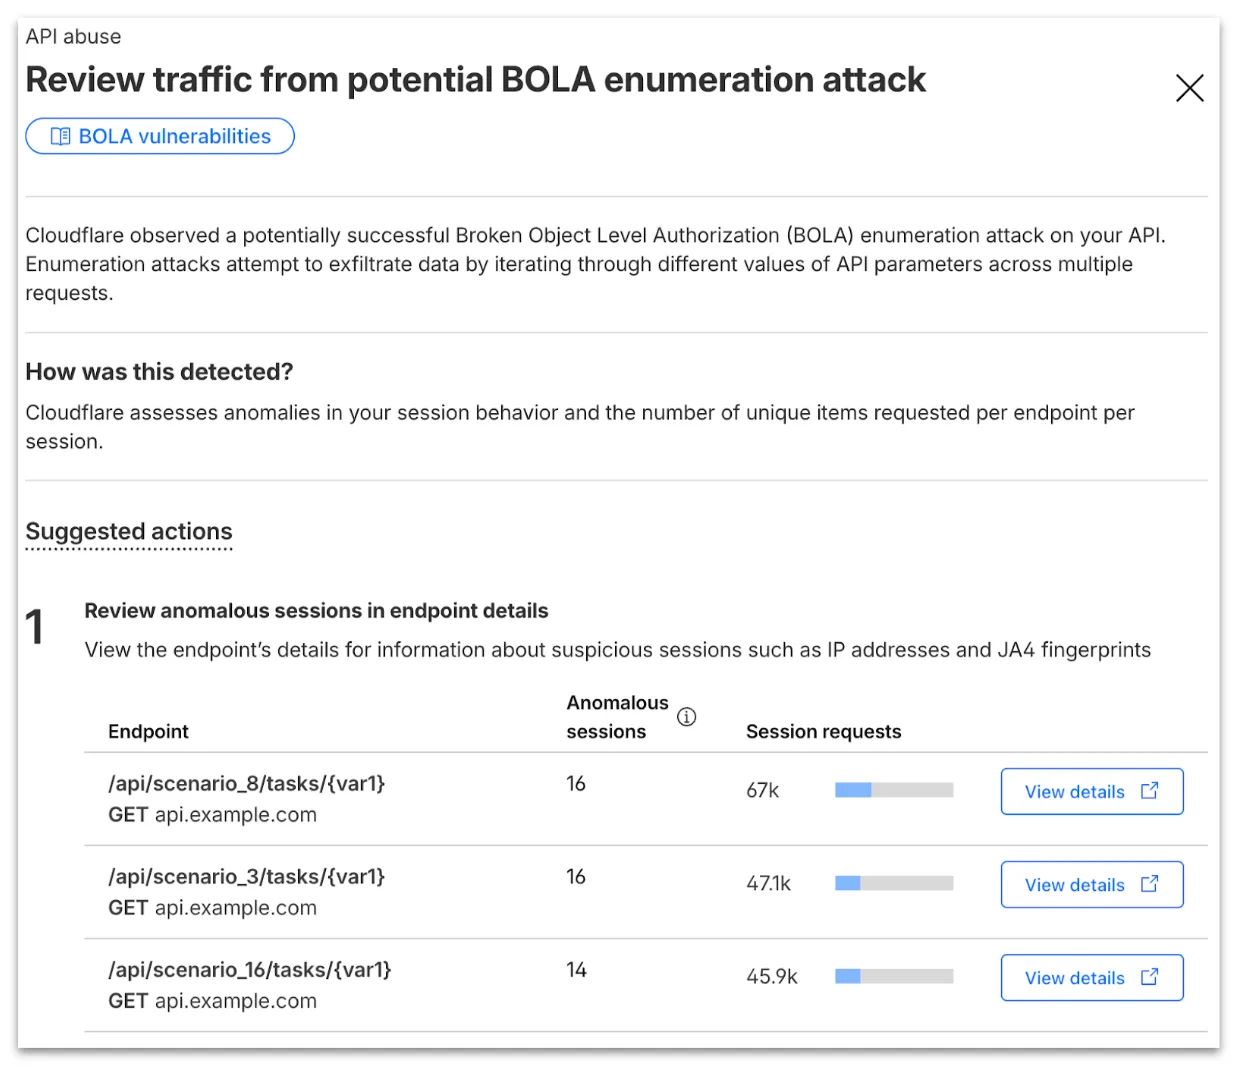
From the endpoint details, you can select View attack to find details about the BOLA attacker’s sessions.
From here, select View in Analytics to observe attacker traffic over time for the last seven days.
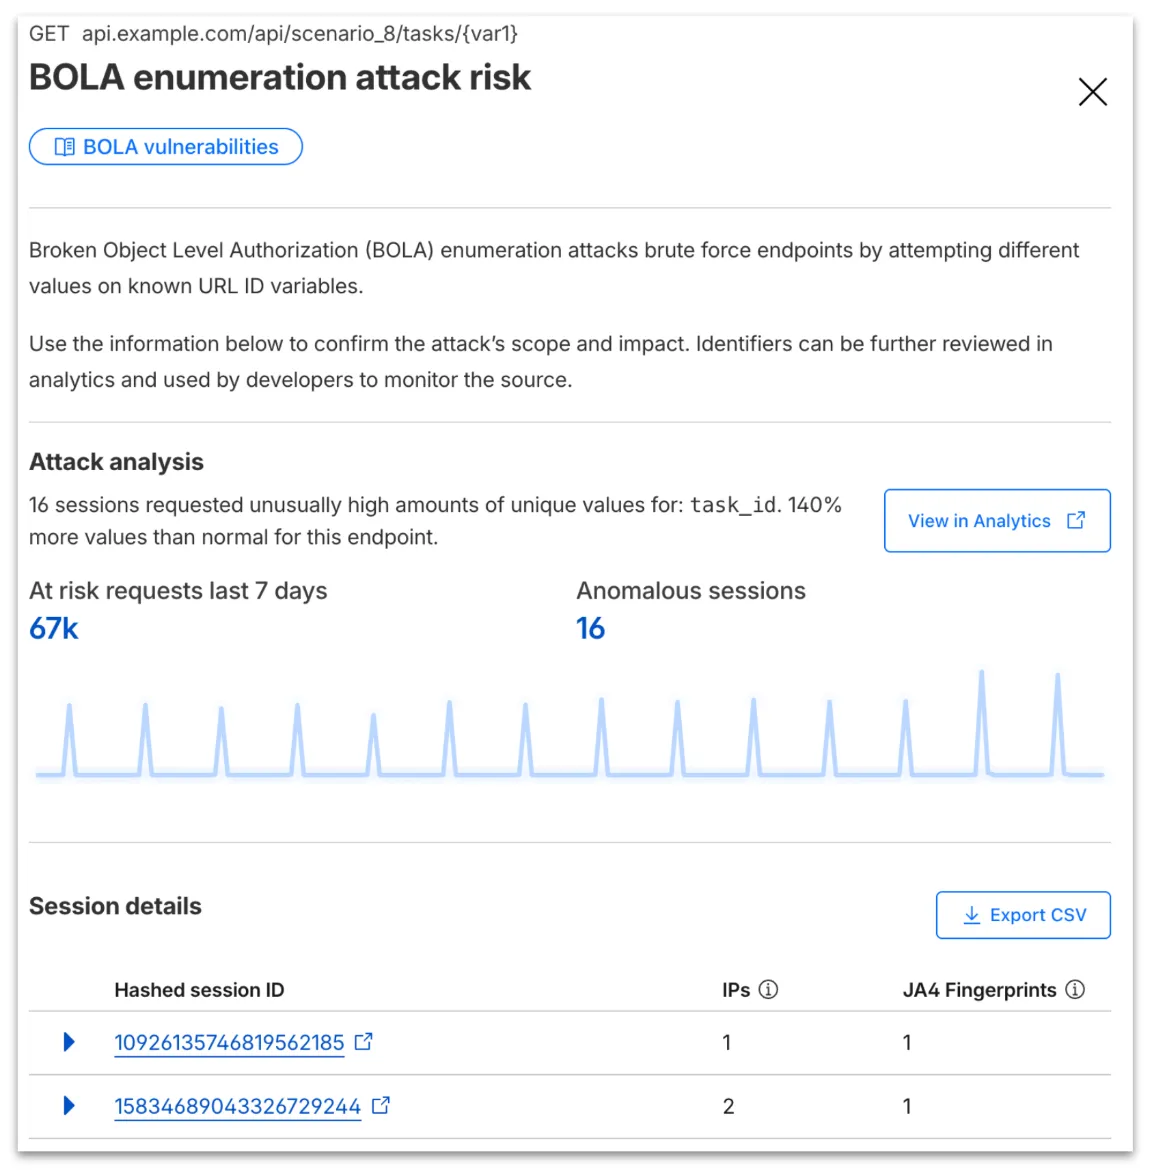
Your search will filter to traffic on that endpoint in the last seven days, along with the malicious session IDs found in the attack. Session IDs are hashed for privacy and will not be found in your origin logs. Refer to IP and JA4 fingerprint to cross-reference behavior at the origin.
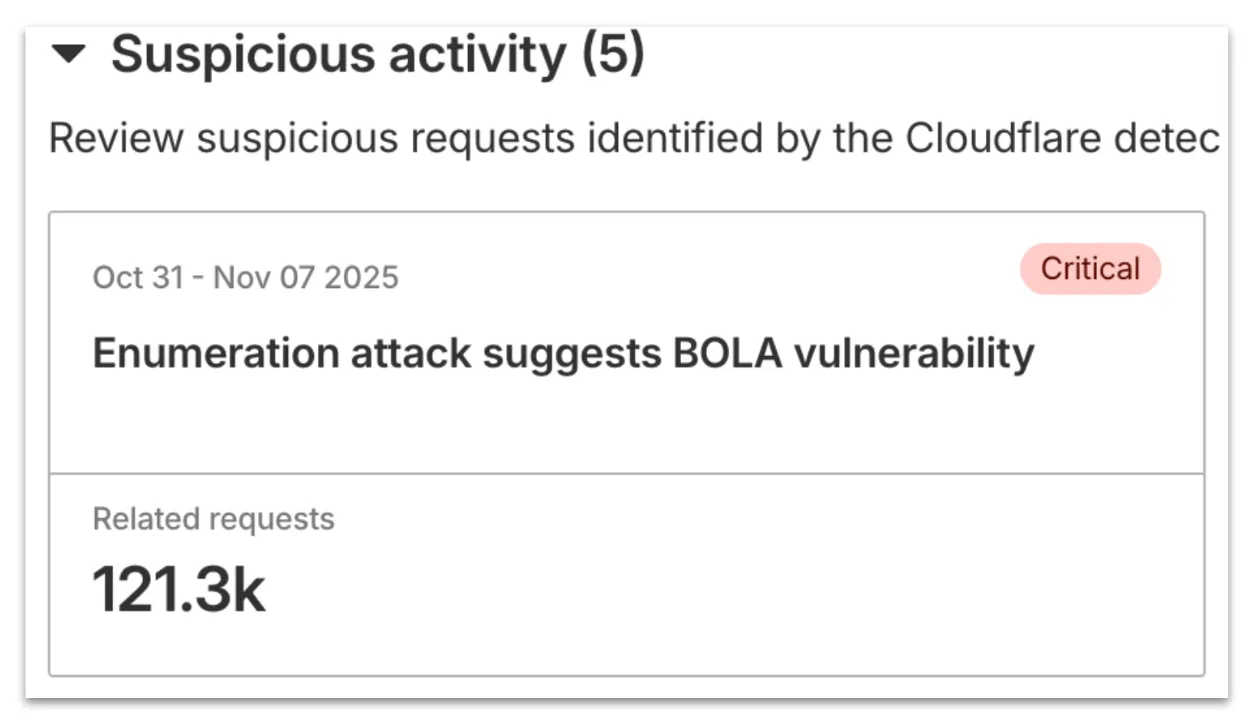
At any time, you can also start your investigation into attack traffic from Security Analytics by selecting the suspicious activity card.
We urge you to take all of this client information to your developer team to research the attacker behavior and ensure any broken authorization policies in your API are fixed at the source in your application, preventing further abuse.
In addition, this release marks the end of the beta period for these scans. All Enterprise customers with API Shield subscriptions will see these new attacks if found on their zone.
Digital Experience Monitoring (DEX) provides visibility into WARP device metrics, connectivity, and network performance across your Cloudflare SASE deployment.
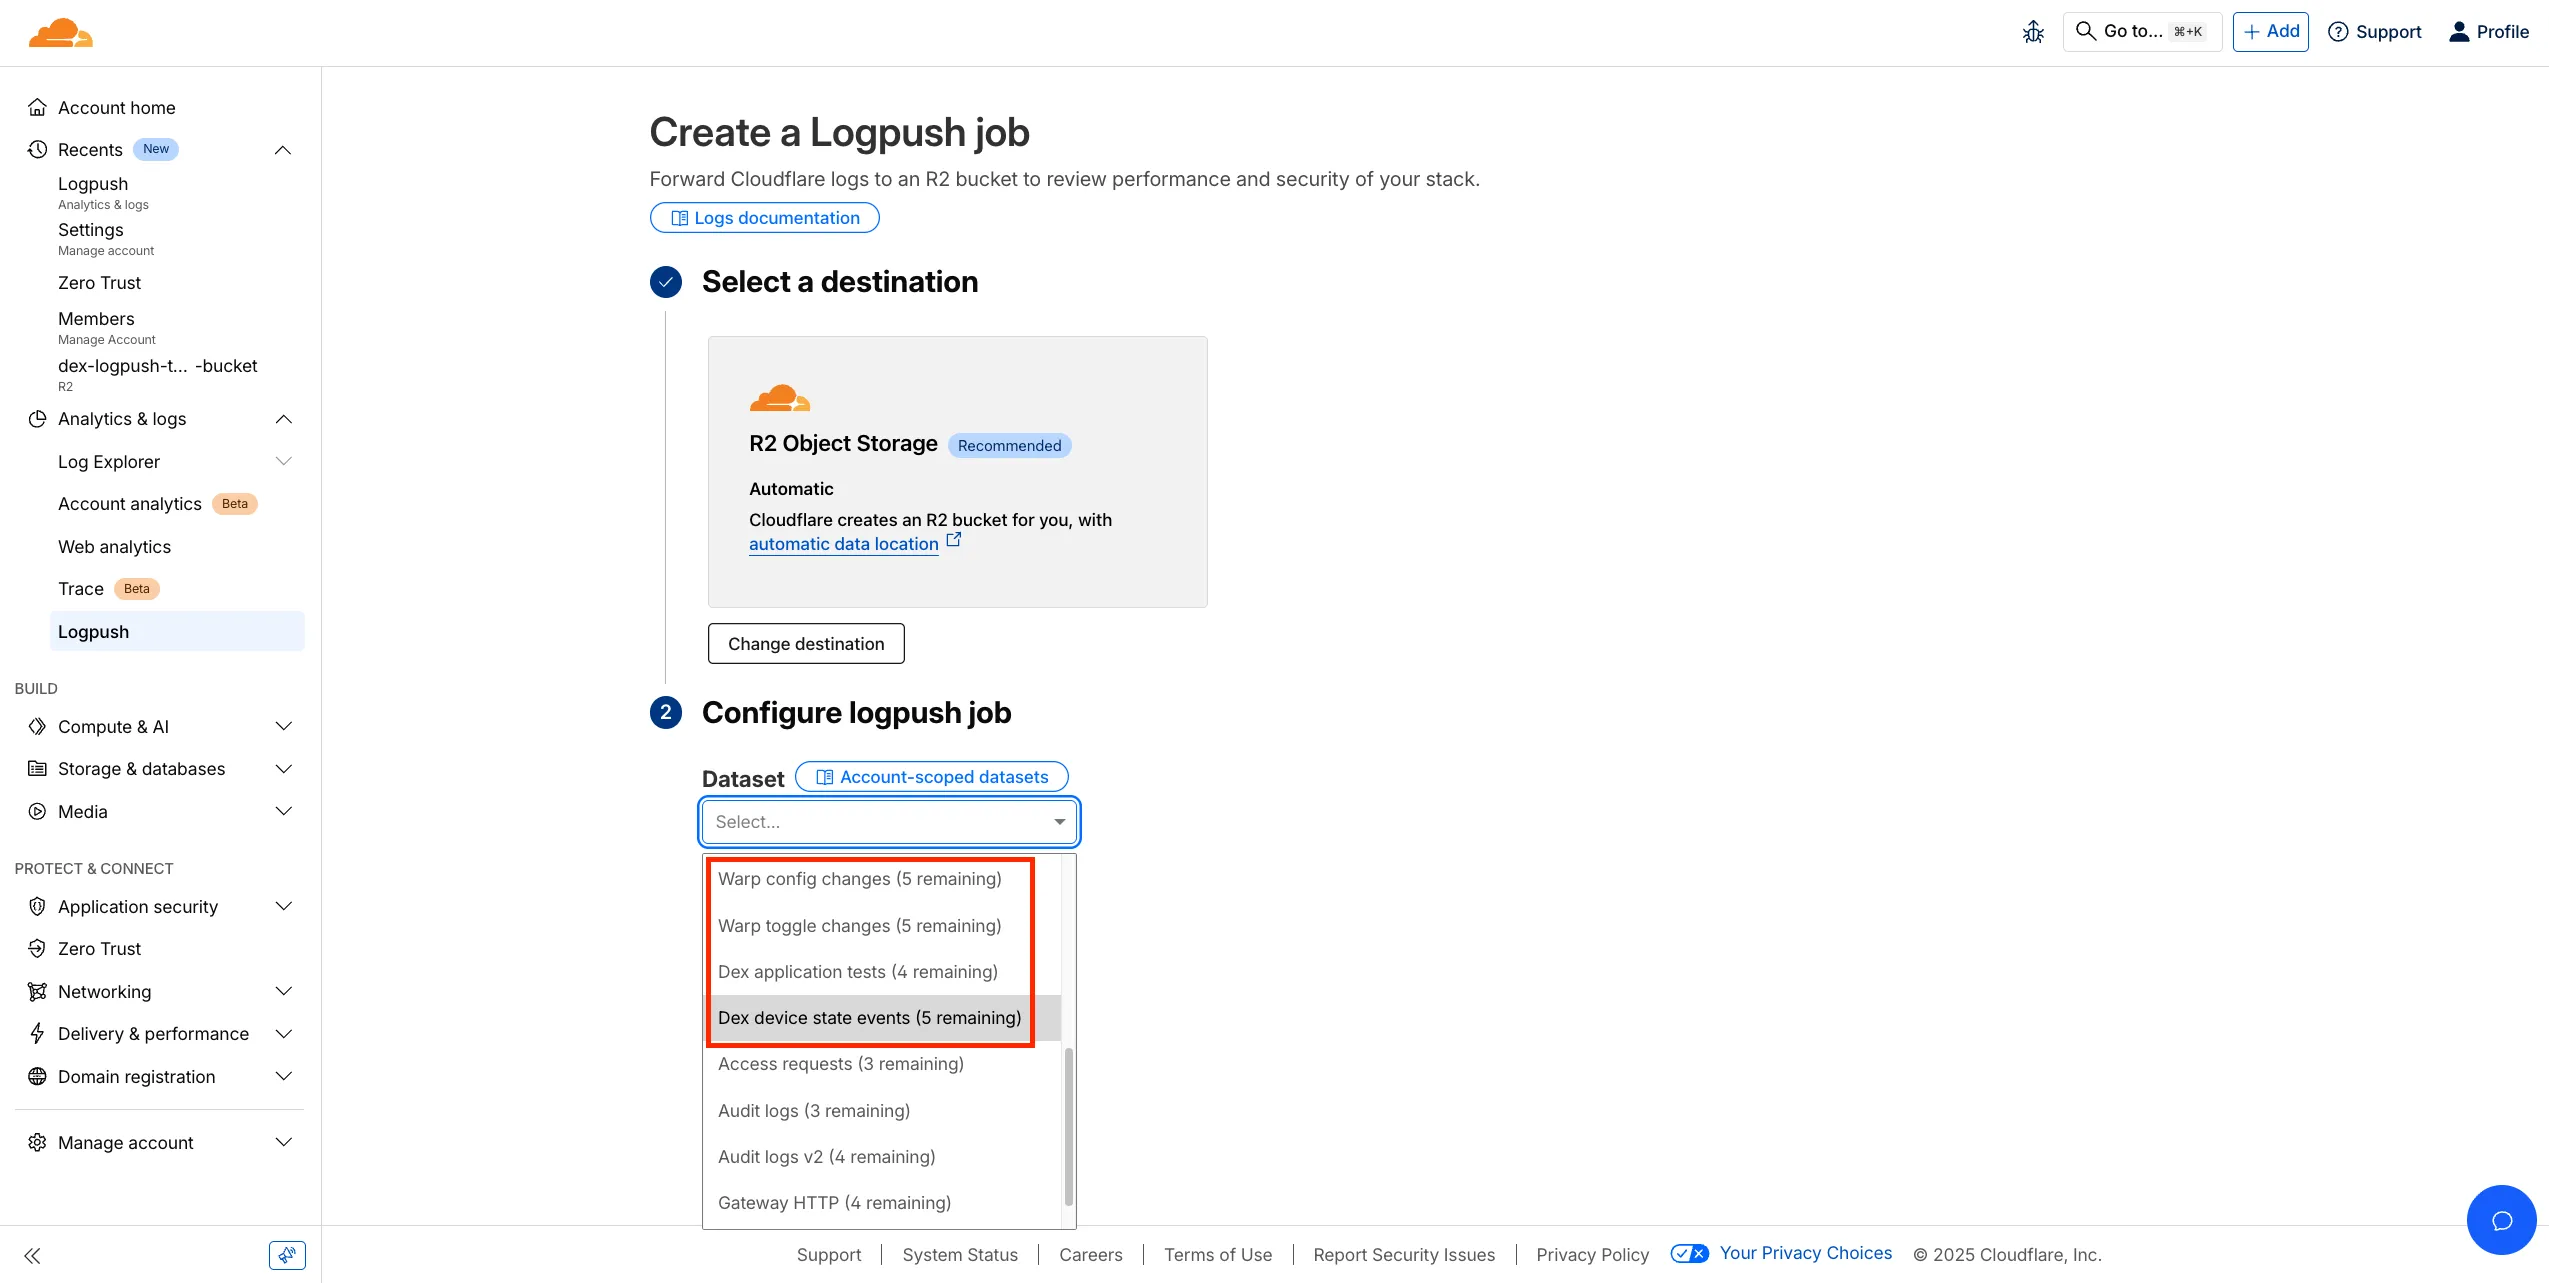
We've released four new WARP and DEX device data sets that can be exported via Cloudflare Logpush. These Logpush data sets can be exported to R2, a cloud bucket, or a SIEM to build a customized logging and analytics experience.
To create a new DEX or WARP Logpush job, customers can go to the account level of the Cloudflare dashboard > Analytics & Logs > Logpush to get started.
You can now perform more powerful queries directly in Workers Analytics Engine ↗ with a major expansion of our SQL function library.
Workers Analytics Engine allows you to ingest and store high-cardinality data at scale (such as custom analytics) and query your data through a simple SQL API.
Today, we've expanded Workers Analytics Engine's SQL capabilities with several new functions:
countIf() - count the number of rows which satisfy a provided conditionsumIf() - calculate a sum from rows which satisfy a provided conditionavgIf() - calculate an average from rows which satisfy a provided conditionNew date and time functions: ↗
toYear()toMonth()toDayOfMonth()toDayOfWeek()toHour()toMinute()toSecond()toStartOfYear()toStartOfMonth()toStartOfWeek()toStartOfDay()toStartOfHour()toStartOfFifteenMinutes()toStartOfTenMinutes()toStartOfFiveMinutes()toStartOfMinute()today()toYYYYMM()Whether you're building usage-based billing systems, customer analytics dashboards, or other custom analytics, these functions let you get the most out of your data. Get started with Workers Analytics Engine and explore all available functions in our SQL reference documentation.
A new GA release for the Windows WARP client is now available on the stable releases downloads page.
This release contains minor fixes, improvements, and new features including Path Maximum Transmission Unit Discovery (PMTUD). When PMTUD is enabled, the client will dynamically adjust packet sizing to optimize connection performance. There is also a new connection status message in the GUI to inform users that the local network connection may be unstable. This will make it easier to diagnose connectivity issues.
Changes and improvements
Known issues
For Windows 11 24H2 users, Microsoft has confirmed a regression that may lead to performance issues like mouse lag, audio cracking, or other slowdowns. Cloudflare recommends users experiencing these issues upgrade to a minimum Windows 11 24H2 KB5062553 or higher for resolution.
Devices using WARP client 2025.4.929.0 and up may experience Local Domain Fallback failures if a fallback server has not been configured. To configure a fallback server, refer to Route traffic to fallback server.
Devices with KB5055523 installed may receive a warning about Win32/ClickFix.ABA being present in the installer. To resolve this false positive, update Microsoft Security Intelligence to version 1.429.19.0 or later.
DNS resolution may be broken when the following conditions are all true:
To work around this issue, reconnect the WARP client by toggling off and back on.
A new GA release for the macOS WARP client is now available on the stable releases downloads page.
This release contains minor fixes, improvements, and new features including Path Maximum Transmission Unit Discovery (PMTUD). When PMTUD is enabled, the client will dynamically adjust packet sizing to optimize connection performance. There is also a new connection status message in the GUI to inform users that the local network connection may be unstable. This will make it easier to diagnose connectivity issues.
Changes and improvements
Known issues
A new GA release for the Linux WARP client is now available on the stable releases downloads page.
This release contains minor fixes, improvements, and new features including Path Maximum Transmission Unit Discovery (PMTUD). When PMTUD is enabled, the client will dynamically adjust packet sizing to optimize connection performance. There is also a new connection status message in the GUI to inform users that the local network connection may be unstable. This will make it easier to diagnose connectivity issues.
WARP client version 2025.8.779.0 introduced an updated public key for Linux packages. The public key must be updated if it was installed before September 12, 2025 to ensure the repository remains functional after December 4, 2025. Instructions to make this update are available at pkg.cloudflareclient.com.
Changes and improvements
We're excited to announce a quality-of-life improvement for Log Explorer users. You can now resize the custom SQL query window to accommodate longer and more complex queries.
Previously, if you were writing a long custom SQL query, the fixed-size window required excessive scrolling to view the full query. This update allows you to easily drag the bottom edge of the query window to make it taller. This means you can view your entire custom query at once, improving the efficiency and experience of writing and debugging complex queries.
To learn more and get started, refer to the Log Explorer documentation.
We’re excited to introduce Logpush Health Dashboards, giving customers real-time visibility into the status, reliability, and performance of their Logpush jobs. Health dashboards make it easier to detect delivery issues, monitor job stability, and track performance across destinations. The dashboards are divided into two sections:
Upload Health: See how much data was successfully uploaded, where drops occurred, and how your jobs are performing overall. This includes data completeness, success rate, and upload volume.
Upload Reliability – Diagnose issues impacting stability, retries, or latency, and monitor key metrics such as retry counts, upload duration, and destination availability.
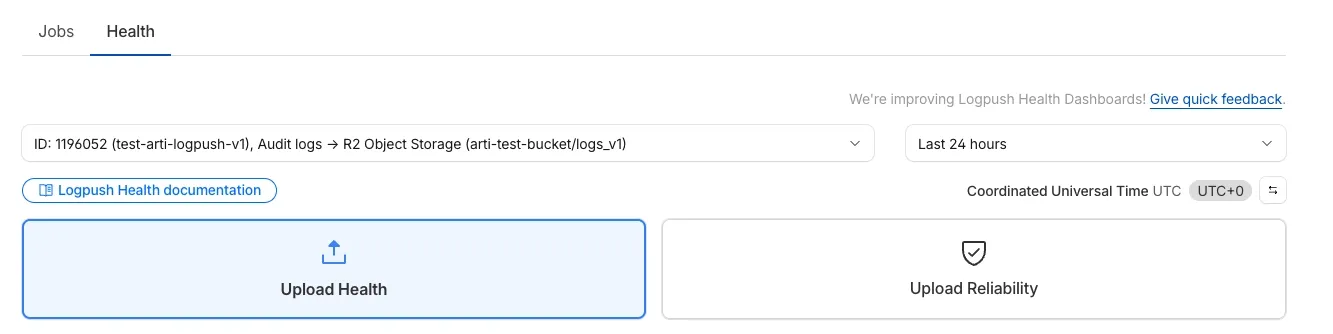
Health Dashboards can be accessed from the Logpush page in the Cloudflare dashboard at the account or zone level, under the Health tab. For more details, refer to our Logpush Health Dashboards documentation, which includes a comprehensive troubleshooting guide to help interpret and resolve common issues.
Starting February 2, 2026, the cloudflared proxy-dns command will be removed from all new cloudflared releases.
This change is being made to enhance security and address a potential vulnerability in an underlying DNS library. This vulnerability is specific to the proxy-dns command and does not affect any other cloudflared features, such as the core Cloudflare Tunnel service.
The proxy-dns command, which runs a client-side DNS-over-HTTPS (DoH) proxy, has been an officially undocumented feature for several years. This functionality is fully and securely supported by our actively developed products.
Versions of cloudflared released before this date will not be affected and will continue to operate. However, note that our official support policy for any cloudflared release is one year from its release date.
We strongly advise users of this undocumented feature to migrate to one of the following officially supported solutions before February 2, 2026, to continue benefiting from secure DNS-over-HTTPS.
The preferred method for enabling DNS-over-HTTPS on user devices is the Cloudflare WARP client. The WARP client automatically secures and proxies all DNS traffic from your device, integrating it with your organization's Zero Trust policies and posture checks.
For scenarios where installing a client on every device is not possible (such as servers, routers, or IoT devices), we recommend using the WARP Connector.
Instead of running cloudflared proxy-dns on a machine, you can install the WARP Connector on a single Linux host within your private network. This connector will act as a gateway, securely routing all DNS and network traffic from your entire subnet to Cloudflare for filtering and logging.
AI Crawl Control now supports per-crawler drilldowns with an extended actions menu and status code analytics. Drill down into Metrics, Cloudflare Radar, and Security Analytics, or export crawler data for use in WAF custom rules, Redirect Rules, and robots.txt files.
The Metrics tab includes a status code distribution chart showing HTTP response codes (2xx, 3xx, 4xx, 5xx) over time. Filter by individual crawler, category, operator, or time range to analyze how specific crawlers interact with your site.
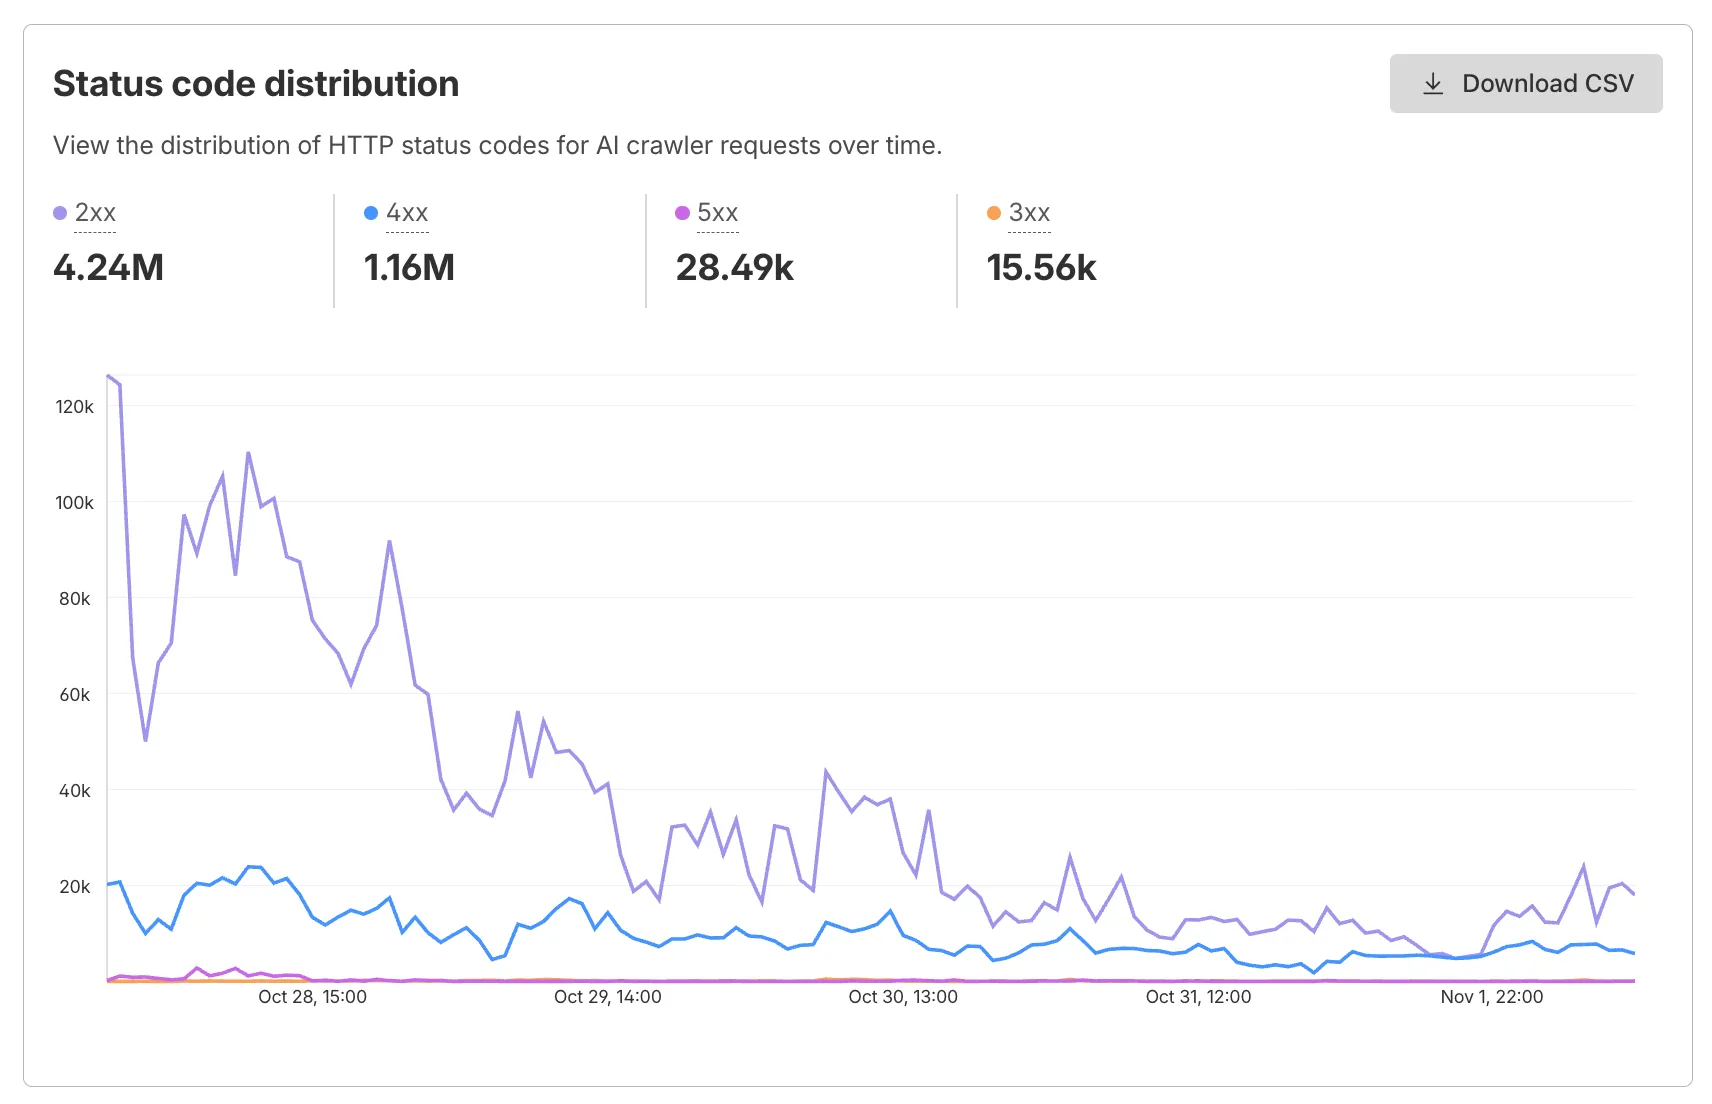
Each crawler row includes a three-dot menu with per-crawler actions:
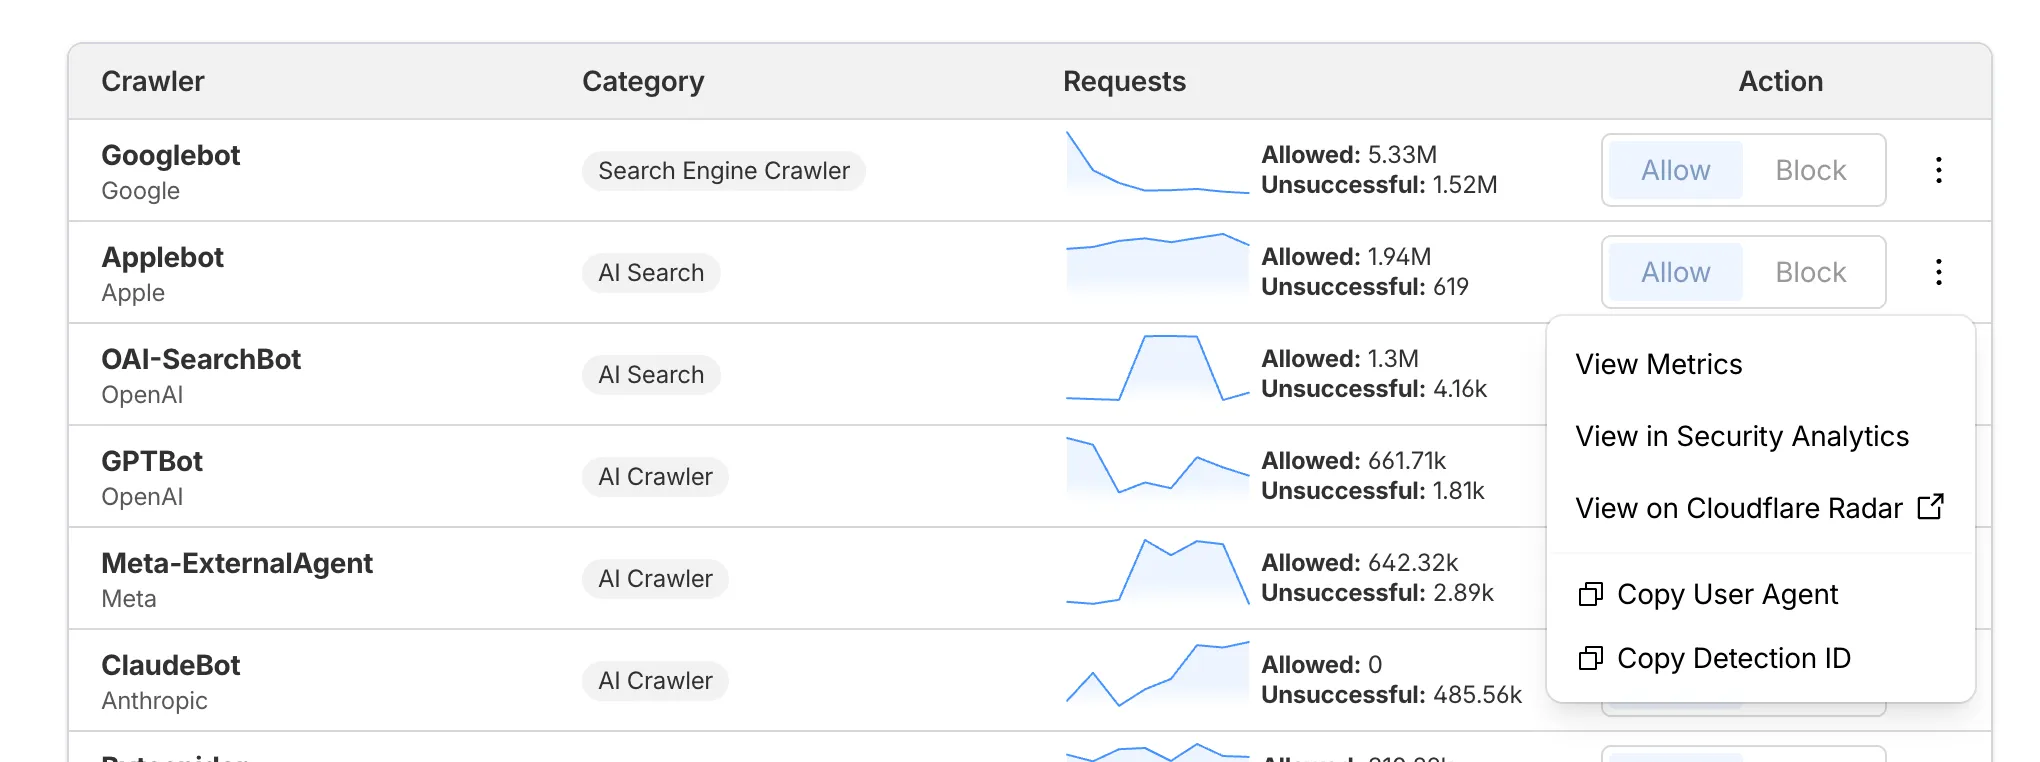
Learn more about AI Crawl Control.
This week’s release introduces new detections for Prototype Pollution across three common vectors: URI, Body, and Header/Form.
Key Findings
Impact
Exploitation may allow attackers to change internal logic or cause unexpected behavior in applications using JavaScript or Node.js frameworks. Developers should sanitize input keys and avoid merging untrusted data structures.
| Ruleset | Rule ID | Legacy Rule ID | Description | Previous Action | New Action | Comments |
|---|---|---|---|---|---|---|
| Cloudflare Managed Ruleset | N/A | Generic Rules - Prototype Pollution - URI | Log | Disabled | This is a new detection | |
| Cloudflare Managed Ruleset | N/A | Generic Rules - Prototype Pollution - Body | Log | Disabled | This is a new detection | |
| Cloudflare Managed Ruleset | N/A | Generic Rules - Prototype Pollution - Header - Form | Log | Disabled | This is a new detection |
Wrangler now supports using the CLOUDFLARE_ENV environment variable to select the active environment for your Worker commands. This provides a more flexible way to manage environments, especially when working with build tools and CI/CD pipelines.
Environment selection via environment variable:
CLOUDFLARE_ENV to specify which environment to use for Wrangler commands--env flag--env command line argument takes precedence over the CLOUDFLARE_ENV environment variable# Deploy to the production environment using CLOUDFLARE_ENVCLOUDFLARE_ENV=production wrangler deploy
# Upload a version to the staging environmentCLOUDFLARE_ENV=staging wrangler versions upload
# The --env flag takes precedence over CLOUDFLARE_ENVCLOUDFLARE_ENV=dev wrangler deploy --env production# This will deploy to production, not devThe CLOUDFLARE_ENV environment variable is particularly useful when working with build tools like Vite. You can set the environment once during the build process, and it will be used for both building and deploying your Worker:
# Set the environment for both build and deployCLOUDFLARE_ENV=production npm run build & wrangler deployWhen using @cloudflare/vite-plugin, the build process generates a "redirected deploy config" that is flattened to only contain the active environment. Wrangler will validate that the environment specified matches the environment used during the build to prevent accidentally deploying a Worker built for one environment to a different environment.